Cut Claude Code Tokens 71x with Graphify: Hands-On Guide (2026)
Make Claude Code read a knowledge graph instead of grepping every file. Install Graphify, compile your codebase + PDFs + docs, and shrink per-query tokens 10x — full walkthrough.

Quick take
Start with this judgment
22 min readBottom line
Make Claude Code read a knowledge graph instead of grepping every file. Install Graphify, compile your codebase + PDFs + docs, and shrink per-query tokens 10x — full walkthrough.
- Best for
- Readers comparing cost, capability, and real limits before choosing a tool
- What to check
- Graphify · Claude Code · knowledge graph
- Watch out
- Pricing and features can change, so confirm with the official source too.
3 key points
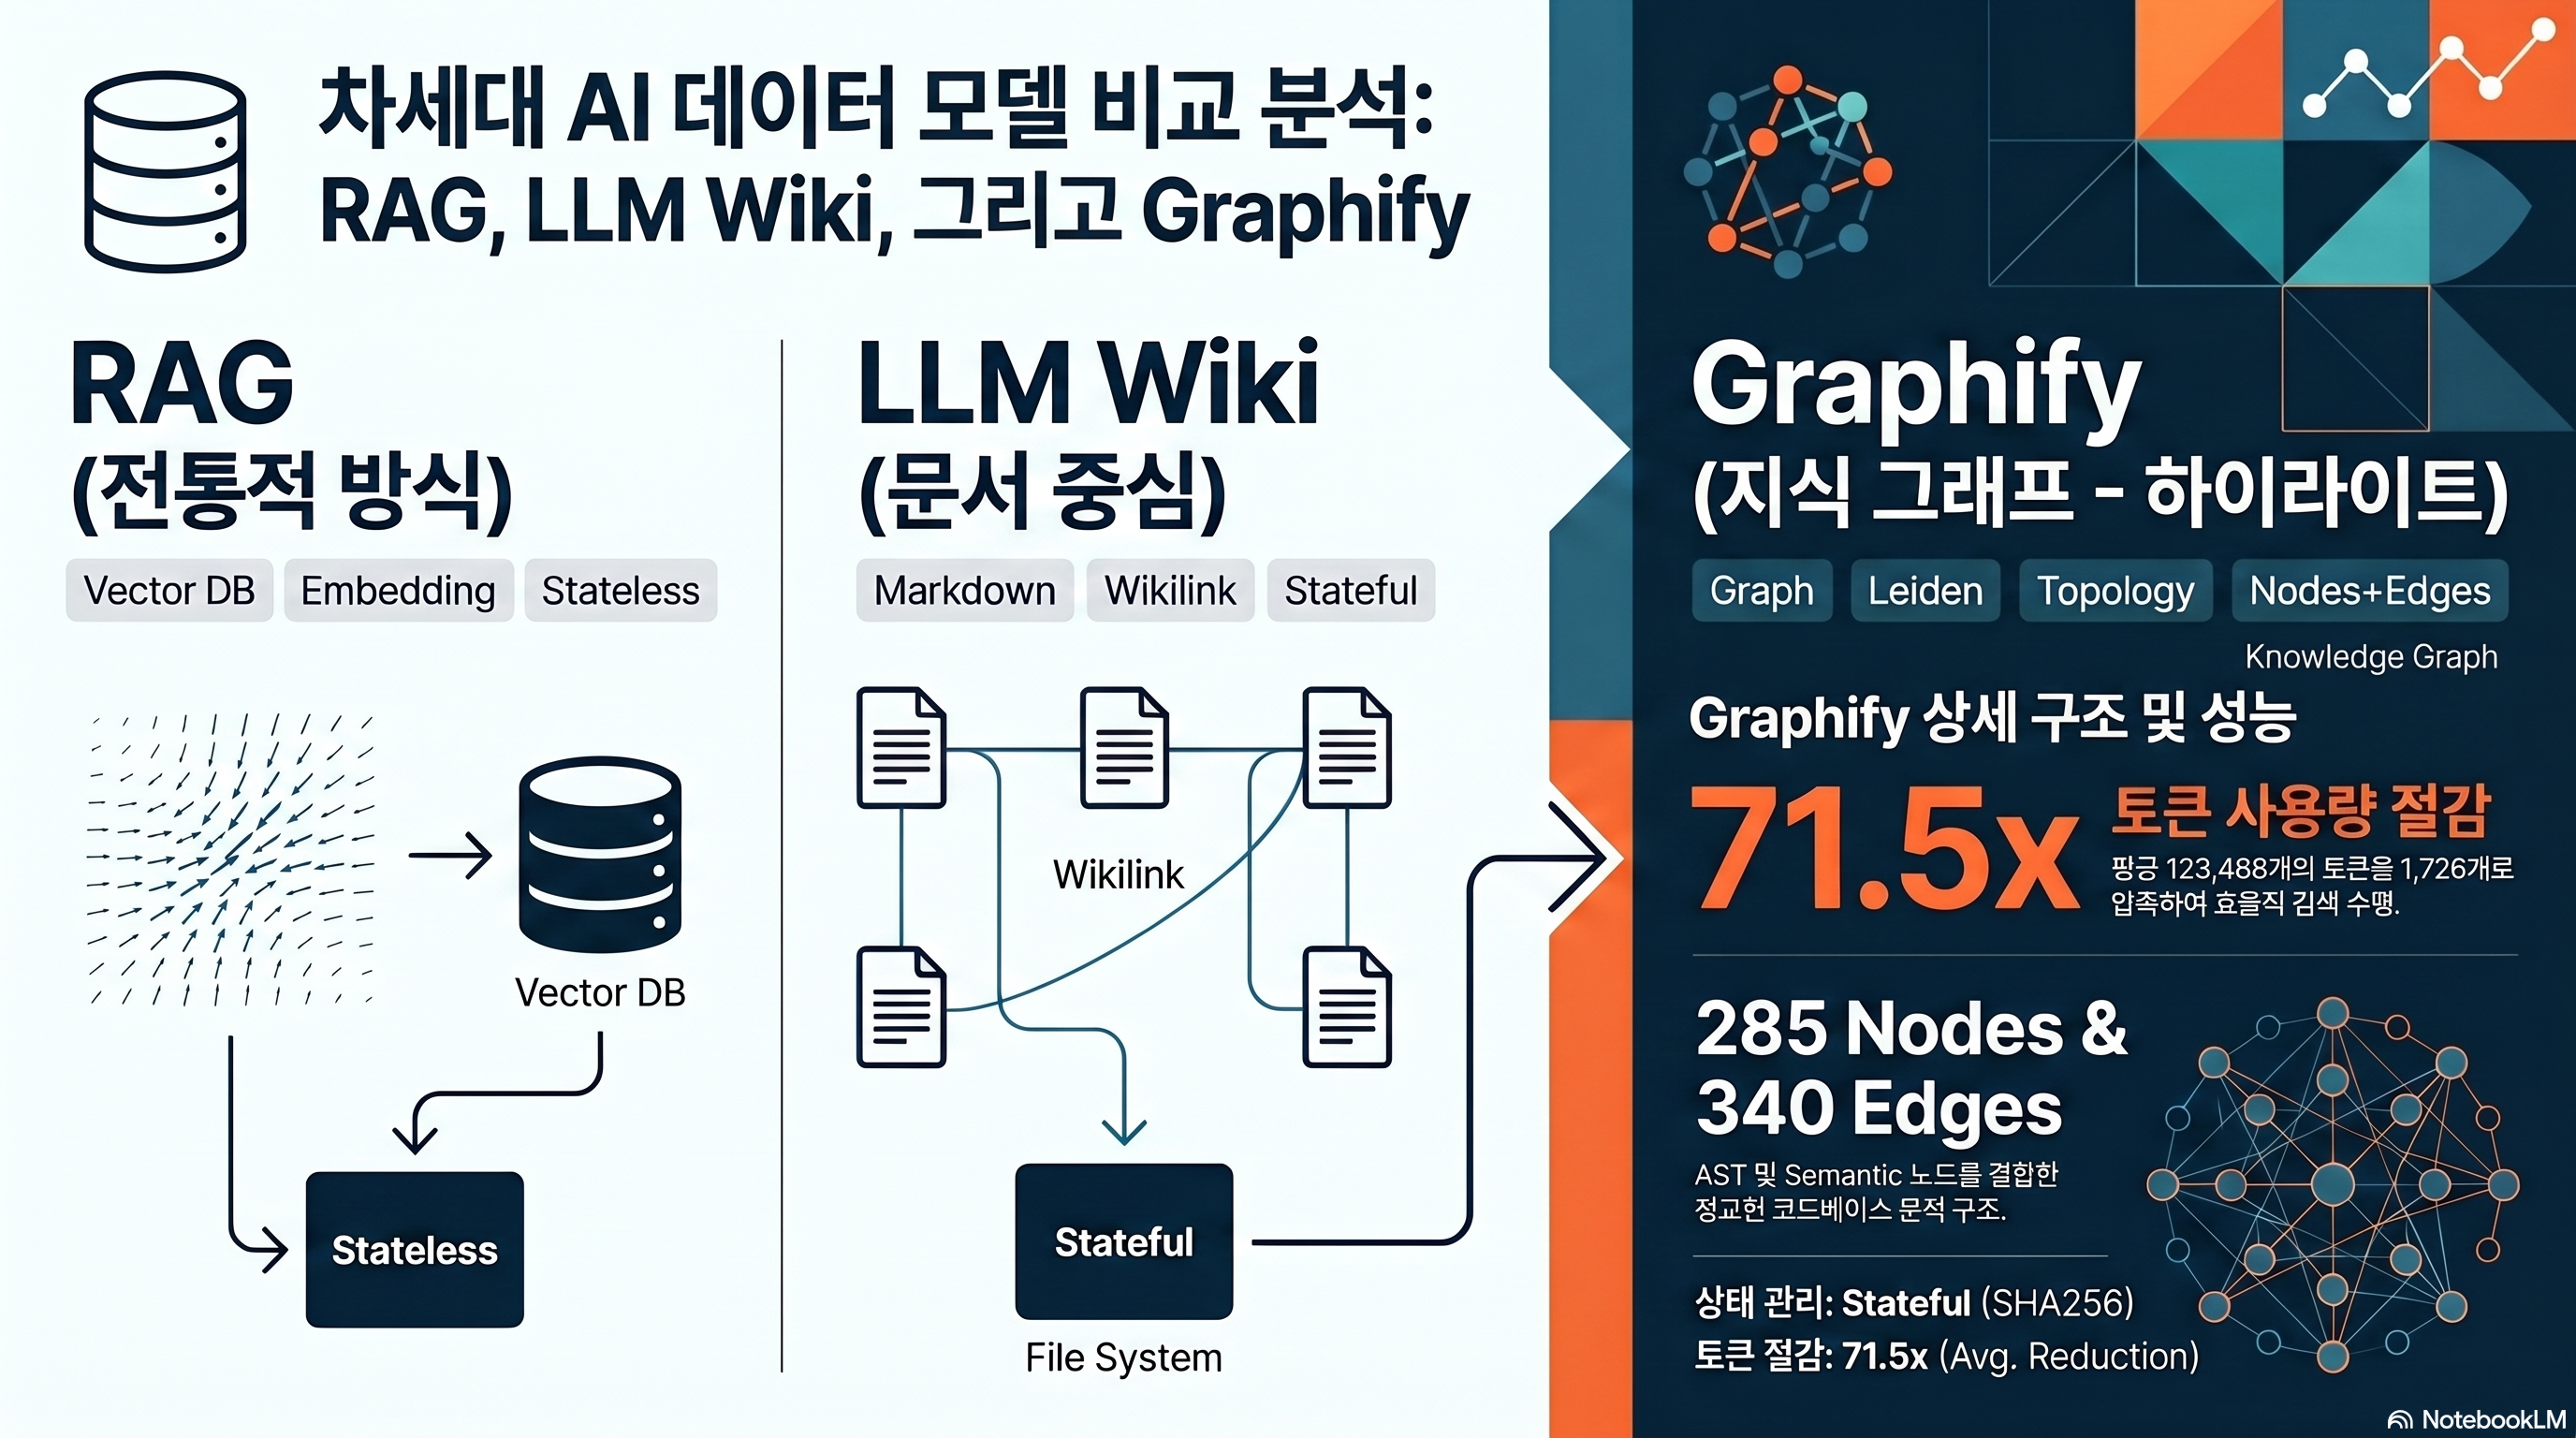
- Graphify compiles your codebase, PDFs, and docs into a “node + edge graph” so Claude Code reads a GRAPH_REPORT first instead of running grep on every query.
- The author’s measurements show an average 71.5x token reduction, but the number swings from 8.8x to 126.7x depending on corpus size and query difficulty (source: Graphify worked/karpathy-repos/review.md).
- After this post, you can run
pip install graphifyy→/graphify .→ wire up the PreToolUse hook in under 15 minutes and reproduce the results on your own repo.
목차
- How is Graphify actually different from RAG?
- Why does the install command use graphifyy with two y's?
- What does /graphify . produce on the first run?
- What are god nodes, INFERRED edges, and Leiden clusters?
- What does the Claude Code hook actually inject?
- How do you ingest Korean HWP, PDF, and news?
- 71x token reduction — what will it be on your codebase?
- Graphify vs code-review-graph vs graphiti — which one now?
- What are the 3 traps that bite hardest in practice?
- After reading this, where should you start?
- Frequently asked questions
This is Part 2 — the build guide of the Karpathy LLM Wiki series. Concepts and background (the source of the 95% reduction claim, why the 3-tier structure makes sense, the fundamental difference from RAG) are covered in Part 1 — Karpathy LLM Wiki Concept Guide. Part 2 only deals with “so how do you actually build it.” From the one-line install to the moment your first graph lands inside Claude Code, real commands and real payloads.
How is Graphify actually different from RAG?
The first question every researcher asks is the same: “isn’t this just GraphRAG?” Short answer, no. Graphify doesn’t index — it compiles. And the compiled output is not a vector store but a networkx graph of nodes + edges, plus a single GRAPH_REPORT.md that Claude can read directly.
Answers questions through topology alone, no vector embeddings
Microsoft GraphRAG chunks documents, extracts entities and relations with an LLM, then generates hierarchical summaries per community and persists them to parquet. The indexing stage calls the LLM dozens of times, which is expensive. LightRAG skips community detection, goes with a flat graph, and runs vector + graph dual retrieval (source: Microsoft GraphRAG).
Graphify takes a different path from both. Code is parsed into ASTs by tree-sitter to make nodes, documents become semantic nodes via regex and link patterns, then networkx-based Leiden community detection groups them. LLM calls during ingest: 0. During queries, also 0 by default. The premise is that “the topology of the graph itself gives you the answer.”
Queries use BFS, not top-k vector search
The query-time behavior makes the difference obvious. Graphify’s benchmark.py picks the top 3 nodes by label match against the question, then expands the subgraph with BFS up to depth=3. That subgraph is flattened to text and handed to Claude (source: benchmark.py).
This is nothing like a vector DB pulling “top-10 similar chunks.” BFS looks at “neighbors connected to this concept by edges.” For example, walking depth 3 from GPTConfig follows GPT → Block → CausalSelfAttention. Top-k semantic similarity cannot guarantee these structural neighbors.
The 3-tier structure isn’t “folder design” — it’s a “compilation target”
The 3-tier structure introduced in Part 1 (raw / wiki / schema) shows up in Graphify as three concrete artifacts. Raw originals go inside worked/, the wiki summary is emitted as GRAPH_REPORT.md, and the schema comes out as graph.json plus a Neo4j/GraphML export. You don’t design the folders first — the compiler emits a 3-tier output, and that’s the key idea.
Why does the install command use graphifyy with two y’s?
Installation is one line, but the first trap shows up here. The PyPI package name doesn’t match intuition.
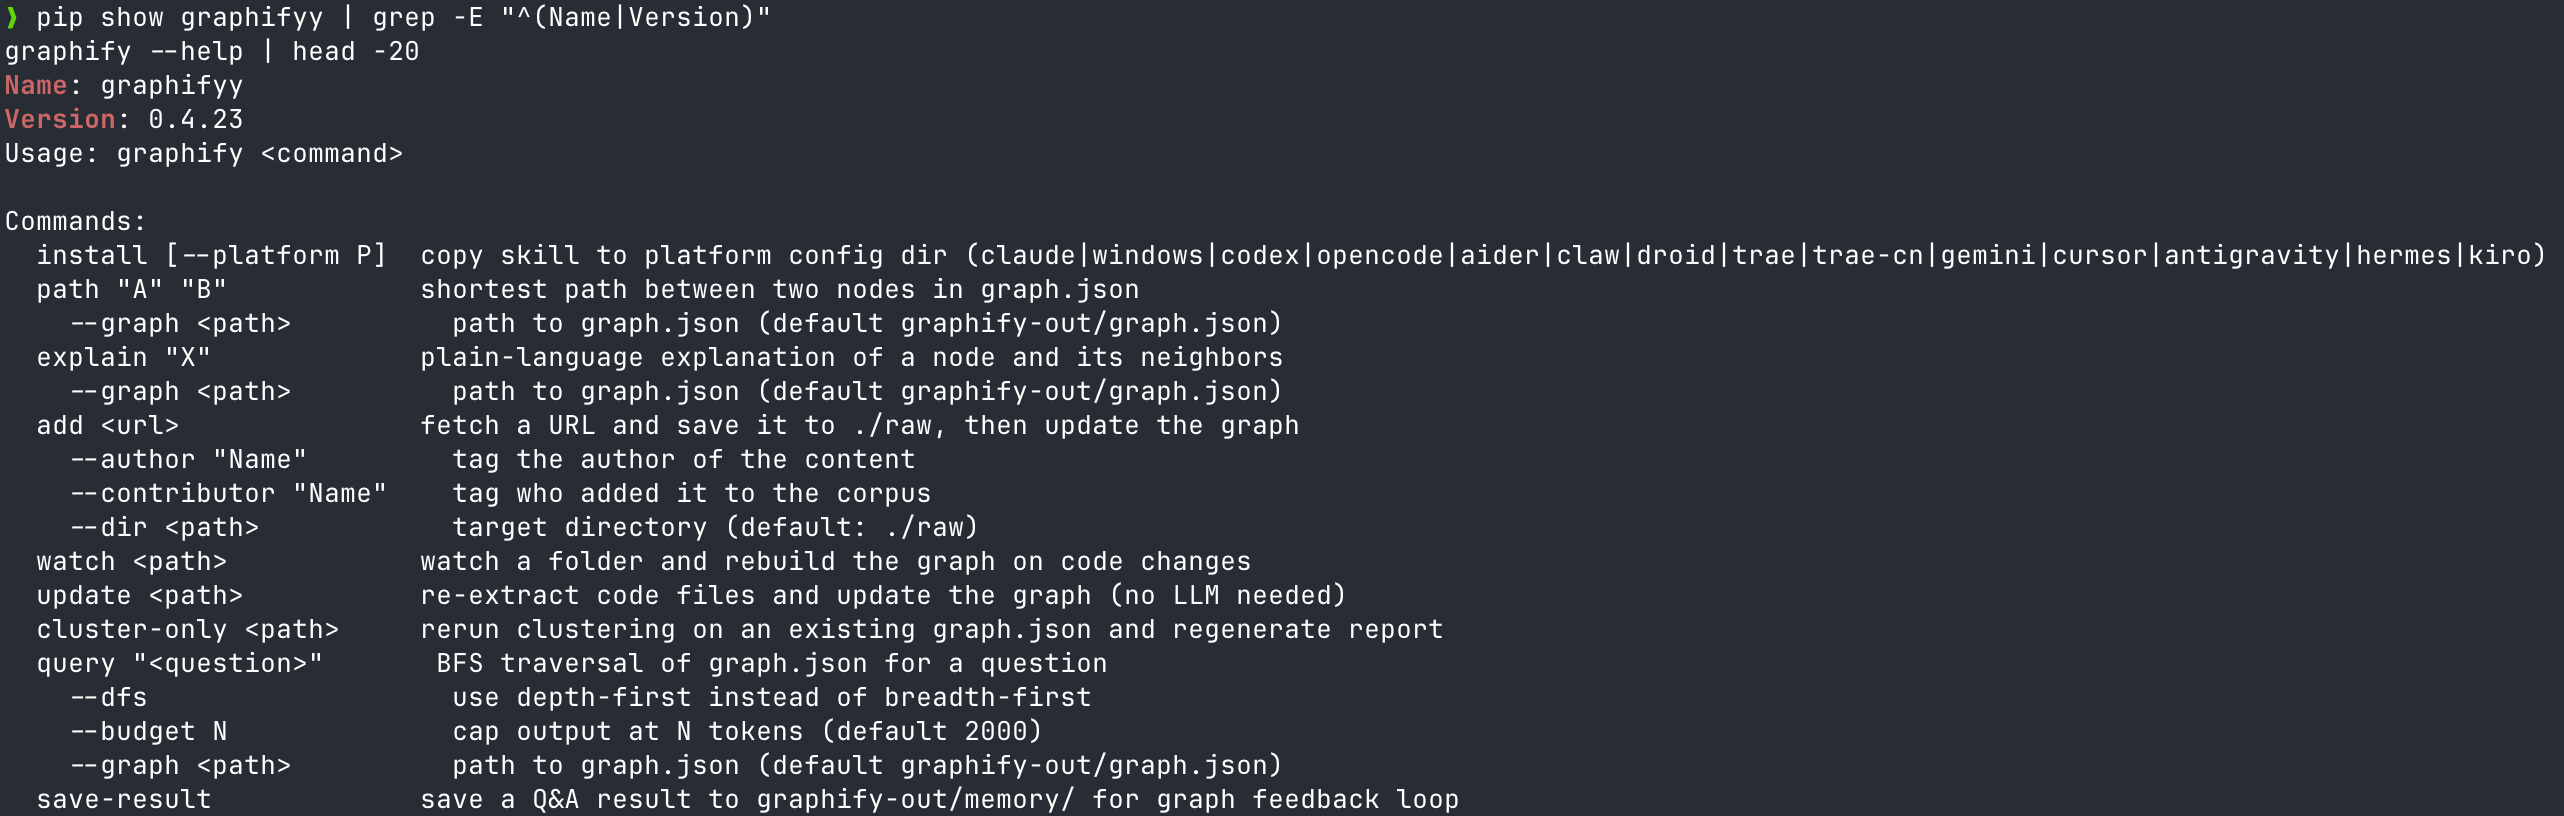
The package name is graphifyy (two y’s)
A warning lives in the very first paragraph of the official README: “PyPI package is named graphifyy. Other packages named graphify* on PyPI are not affiliated.” Someone else had grabbed the name graphify first, so the author added an extra y (source: Graphify README).
If you don’t know this and run pip install graphify, you’ll install a completely different, unmaintained package. Get into the habit of checking the author and homepage with pip show.
# Correct install
pip install graphifyy

# Optional extras (PDF / video / office / watch mode)
pip install "graphifyy[pdf,video,office,watch,mcp,neo4j]"
Python 3.10 or higher is required. Anything below 3.9 fails at install time (source: pyproject.toml).
When to add the extras
The base install lets you build code graphs but not PDFs, videos, or Obsidian exports. Each extra resolves to:
| extras | Added dependencies | When to use |
|---|---|---|
| `pdf` | pypdf, html2text | Bundling papers and white papers with code |
| `video` | faster-whisper, yt-dlp | Conference talks and YouTube URL ingest |
| `office` | python-docx, openpyxl | DOCX/XLSX ingest (warning: HWP not supported) |
| `watch` | watchdog | Auto-rebuild graph on file changes |
| `mcp` | mcp | Expose to Claude Code as an MCP server |
| `neo4j` | neo4j | Push to Neo4j Aura or local instance |
| `leiden` | graspologic (no Python 3.13 support) | Leiden clustering (Louvain fallback if missing) |
Platform install — graphify install [--platform]
After the package install comes the AI tool integration. Graphify wires hooks into 14 agent platforms through a single CLI.
graphify install --platform claude    # Claude Code
graphify install --platform codex     # Codex
graphify install --platform gemini    # Gemini CLI
graphify install --platform opencode  # OpenCode
graphify install --platform cursor    # Cursor
# Plus copilot, aider, claw, droid, trae, trae-cn, hermes, kiro, vscode, antigravity
Running just graphify install detects every platform present in the current directory and installs them in one shot (source: main.py).
What does /graphify . produce on the first run?
Once installed, you build the graph from your repo root with a single command. The output here is the physical implementation of the 3-tier structure from Part 1.
Default output: a single graphify-out/ folder
Running graphify . or graphify /path/to/repo creates graphify-out/ in your working directory. Default artifacts:
graphify-out/
├── graph.json          # Nodes + edges + metadata (schema tier)
├── GRAPH_REPORT.md     # Summary markdown for LLM consumption (wiki tier)
├── graph.html          # Interactive pyvis visualization
├── graph.graphml       # For Gephi / Cytoscape import
└── clusters.json       # Leiden community assignments
Flags like --wiki, --svg, --obsidian, --neo4j-push <url> add output formats. To drop straight into an Obsidian Vault, point at the path with graphify . --obsidian ~/Documents/MyVault (source: main.py).
Code goes through tree-sitter, docs through a regex pipeline
22 languages are parsed into ASTs via tree-sitter grammars. Python, JavaScript, TypeScript, Go, Rust, Java, C/C++, Ruby, C#, Kotlin, Scala, PHP, Swift, Lua, Zig, PowerShell, Elixir, Objective-C, Julia, and Verilog. The README claims “25 languages” — in reality it’s 22 tree-sitter + 3 regex-based (Vue, Svelte, Dart) = 25, which is the precise count (source: pyproject.toml).
Document extensions keep growing across v0.4.16–v0.4.23
In the last two weeks, PRs for .mdx recognition (Issue #428), bringing .html into DOC_EXTENSIONS (Issue #260), fixing Go import ID collisions (Issue #431), and fixing to_html() crashes above 5,000 nodes (Issue #432) all merged in succession. Between 2026-04-16 and 04-18, eight releases shipped — v0.4.16 to v0.4.23 in three days (source: Graphify releases).
That pace cuts both ways. Bugs get fixed fast, but skipping updates for three days means you’re on a “different version.” For production rollout, pin the version.
What are god nodes, INFERRED edges, and Leiden clusters?
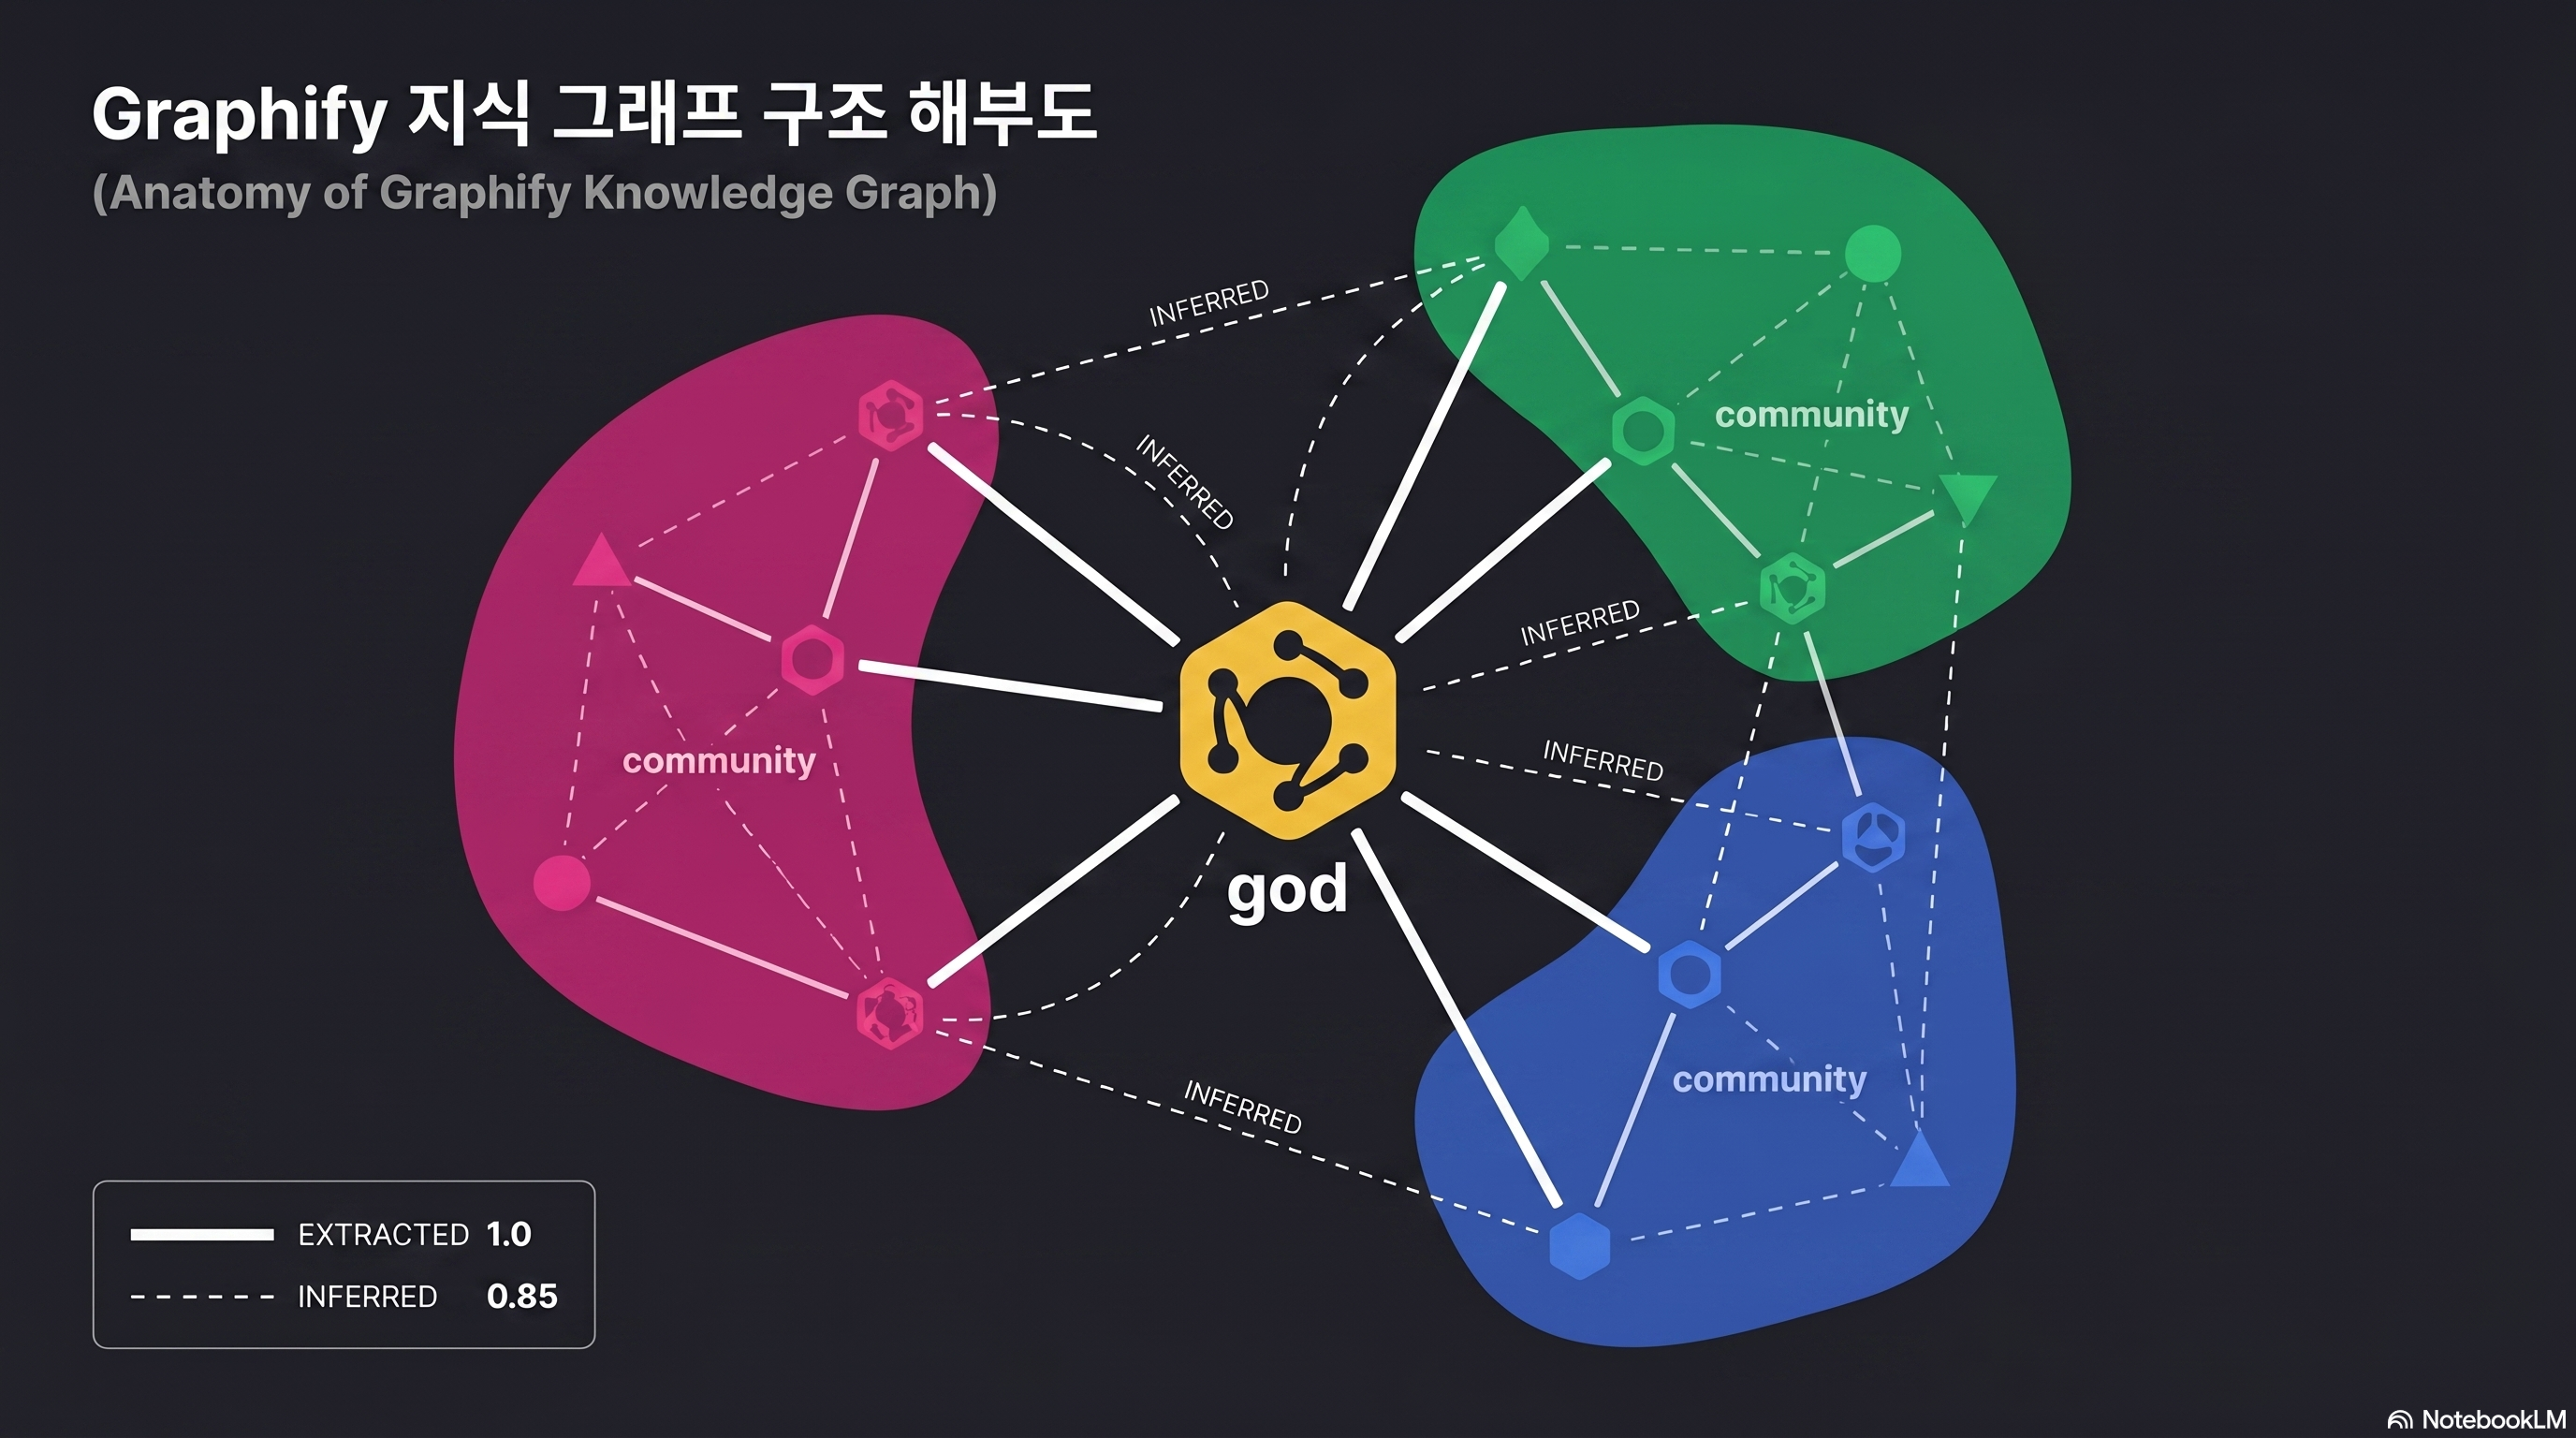
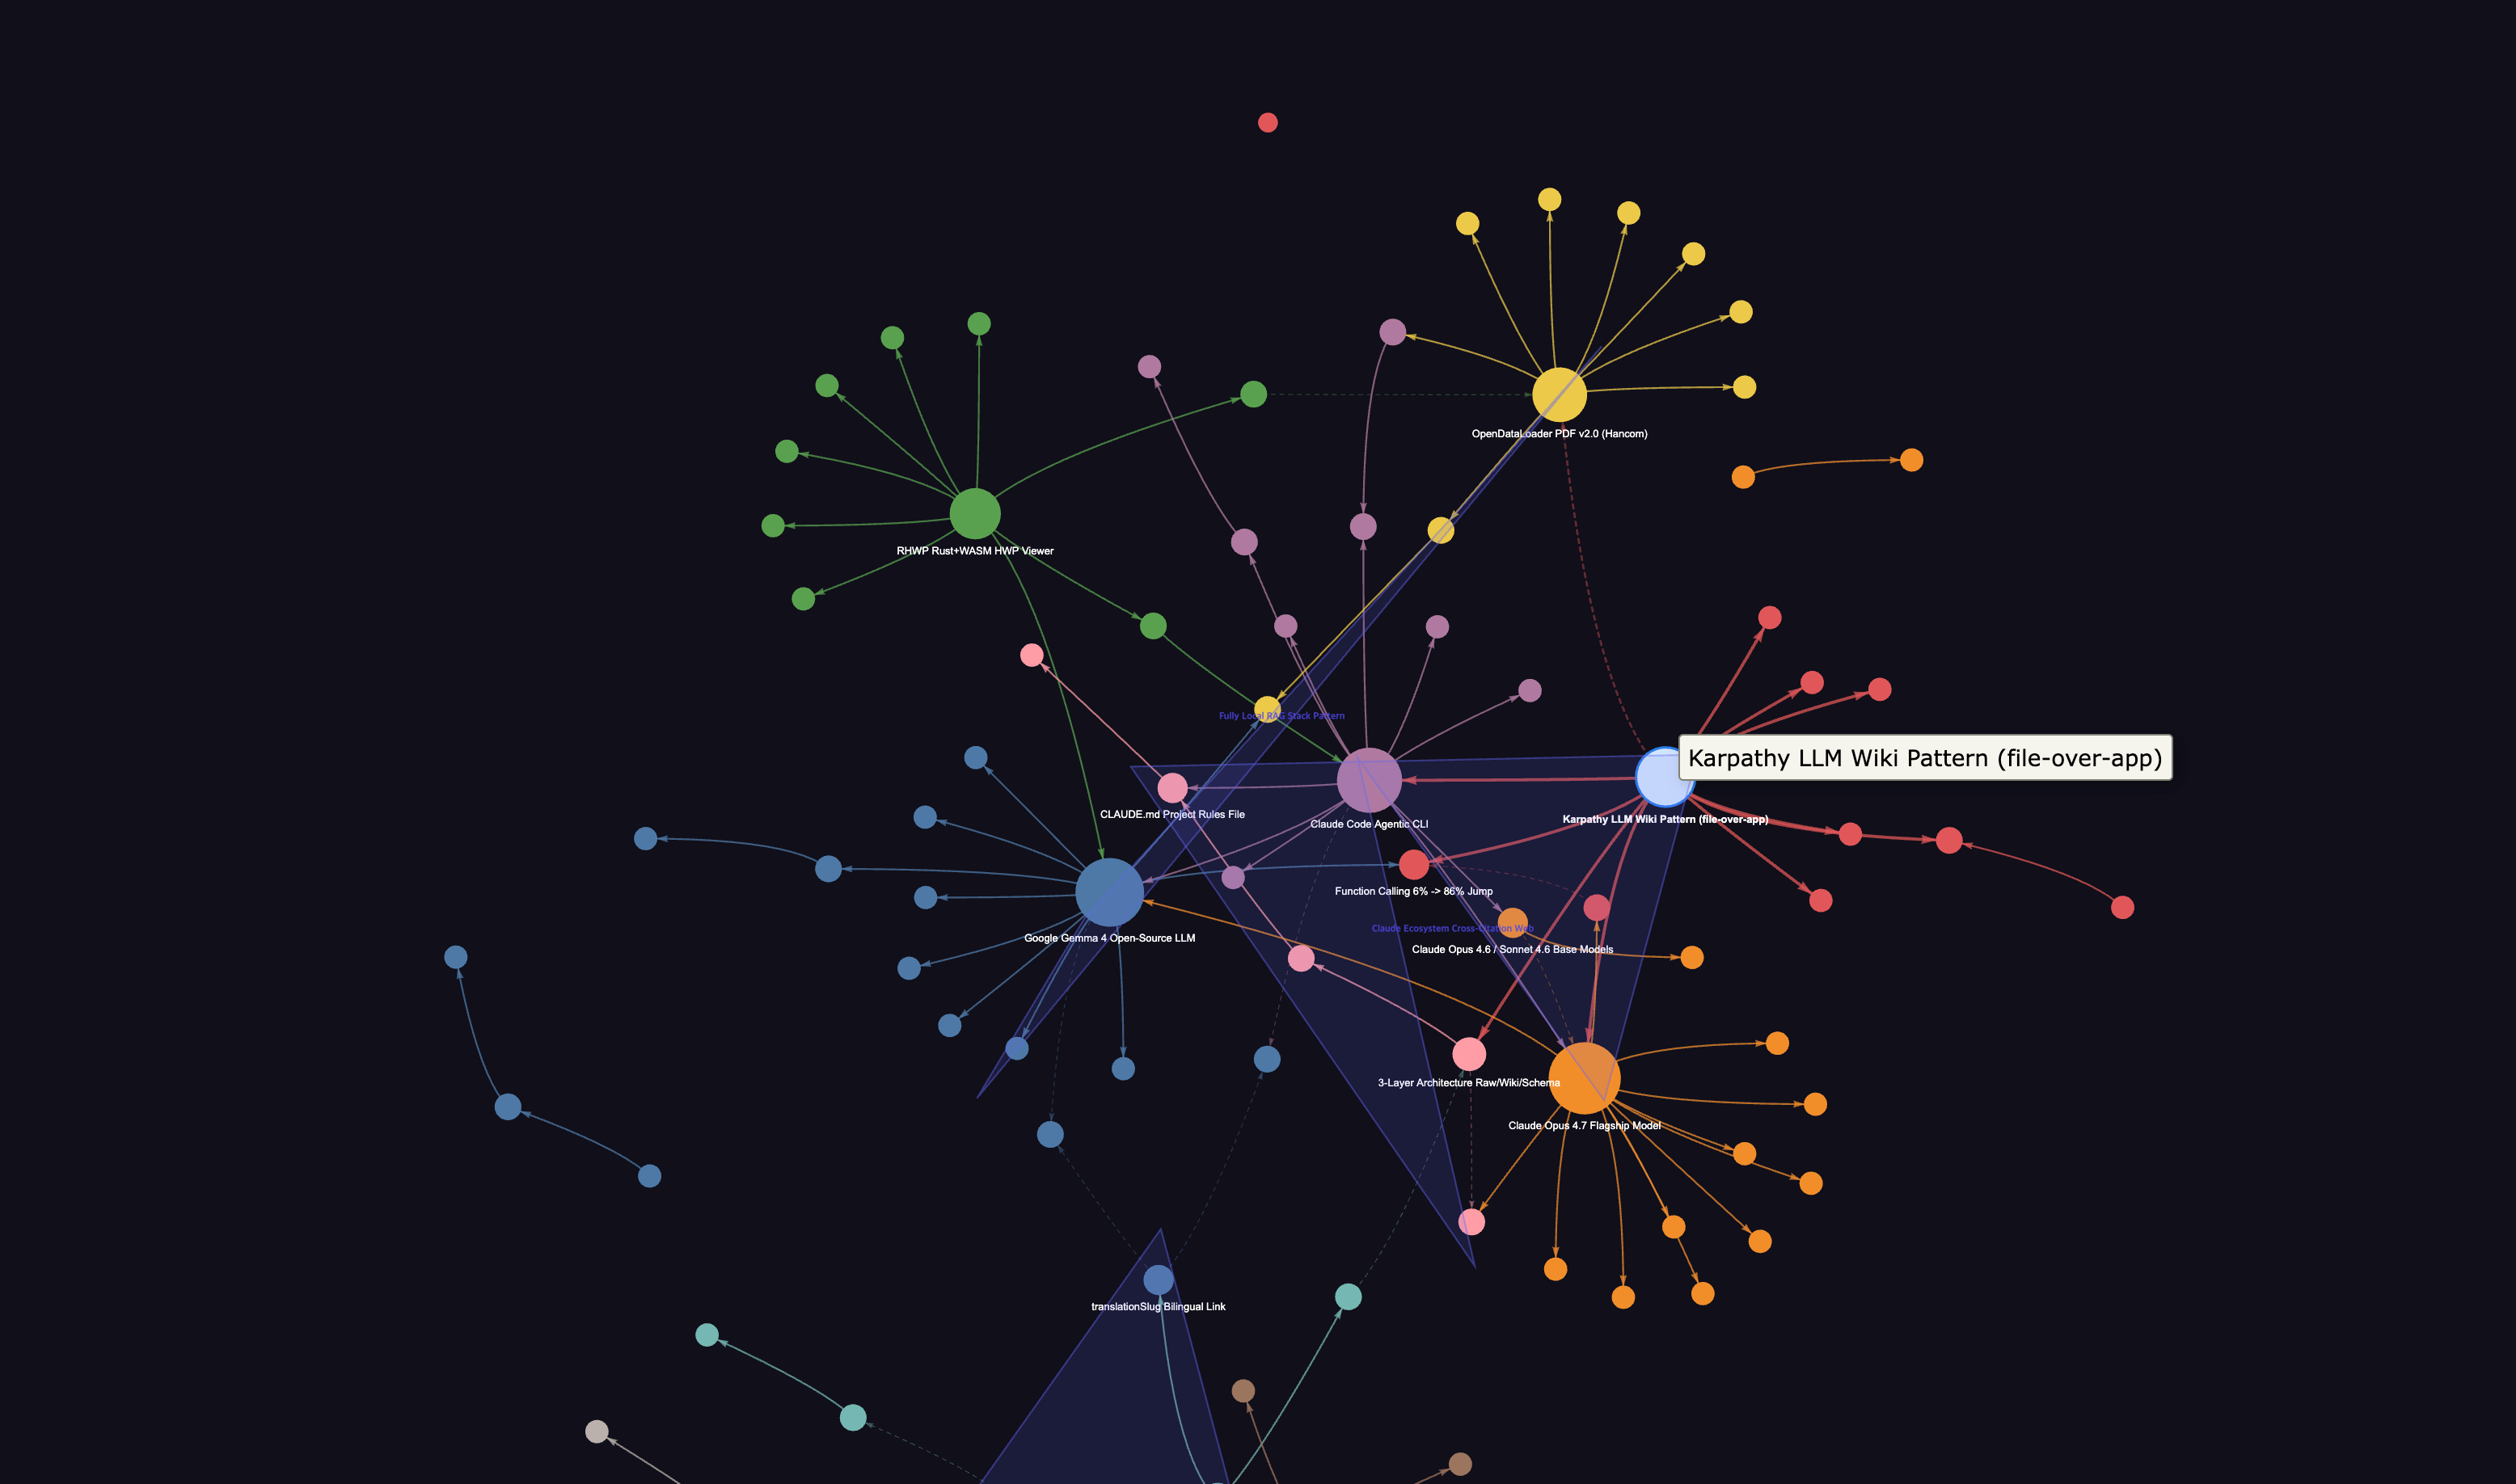
Open the generated graph.html in a browser and you’ll see an unfamiliar diagram of spheres connected to each other. If you can’t read this picture, half the reason to use Graphify disappears. Start by learning three terms.
god node — the architectural pivot
analyze.py picks the top 10 nodes by degree, but only keeps non-trivial hubs. Specifically, _is_file_node() filters out anything matching a filename or .method() form, and _is_concept_node() handles extension-less semantic nodes separately (source: analyze.py).
The result: not “util.py that every file imports” — a trivial file hub — but abstract concepts like GPTConfig, Block, and CausalSelfAttention that sit at the architectural center remain as god nodes. On the surface this resembles hub detection in scale-free networks, but the filtering rules are stricter.
INFERRED edges — relations not declared in code
Normal edges come straight from the AST. class GPT(nn.Module): produces a GPT --extends--> nn.Module edge. But Graphify also adds INFERRED edges based on label similarity, positional proximity, and mention patterns within documents. It infers undeclared relations like “two functions that appear in the same file” or “concepts mentioned in the same document section.”
This is both the strength and the danger. The strength: documents and code get bridged so Claude understands “the FlashAttention section is connected to the CausalSelfAttention implementation.” The danger: a wrong INFERRED edge can become a hallucination source.
Each edge carries a confidence score. EXTRACTED is always 1.0, INFERRED is 0.4–0.9 depending on model confidence (e.g., cross-file call inference is fixed at 0.8), and AMBIGUOUS sits at 0.1–0.3 as candidates that need human review (source: validate.py). Edges below 0.3 are auto-flagged in the review section of GRAPH_REPORT.md, so a one-pass scan to weed out misinferences blocks hallucinations before they happen.
Hyperedges — group relations that bind 3+ nodes at once
Standard graph libraries only handle pairwise edges connecting two nodes. But situations like “all classes implementing a common protocol,” “all functions participating in an auth flow,” or “node groups that jointly form a single concept in one paper section” — cases where 3 or more nodes carry meaning as a single bundle — are not rare. Graphify stores these separately in the top-level hyperedges array of graph.json (source: CHANGELOG v0.3.0).
If god nodes show “single hubs,” hyperedges catch clusters that move together without a hub. They run on a different track from Leiden community detection results, so cross-referencing the two while reading GRAPH_REPORT.md makes your architecture picture far more solid.
Leiden communities — natural lumps in the architecture
The Leiden algorithm was proposed by Traag, Waltman, and van Eck in 2019, fixing Louvain’s “badly-connected community” problem. Louvain can produce up to 25% badly-connected and up to 16% disconnected communities, while Leiden guarantees connectivity through a refinement phase (source: arXiv:1810.08473).
Graphify try-imports leiden() from graspologic (a Microsoft Research + Johns Hopkins NeuroData collaboration), and falls back to networkx’s louvain_communities if it fails (source: cluster.py).
graspologic carries a python_version < '3.13' constraint as a dependency. On Python 3.13+, the Louvain fallback kicks in automatically, so the README’s “Leiden guaranteed” description diverges from real behavior. When comparing clustering quality against release notes, you need to be aware of this.
What does the Claude Code hook actually inject?
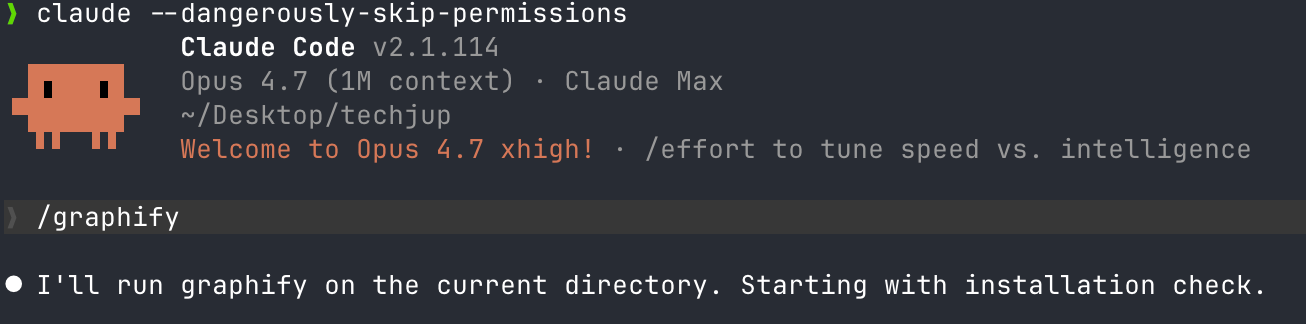
This is where many reviewers get it wrong. Graphify does not intercept Claude Code’s responses. It does not block tool calls. It only injects a one-line reminder to read GRAPH_REPORT.md first.
The actual PreToolUse hook payload
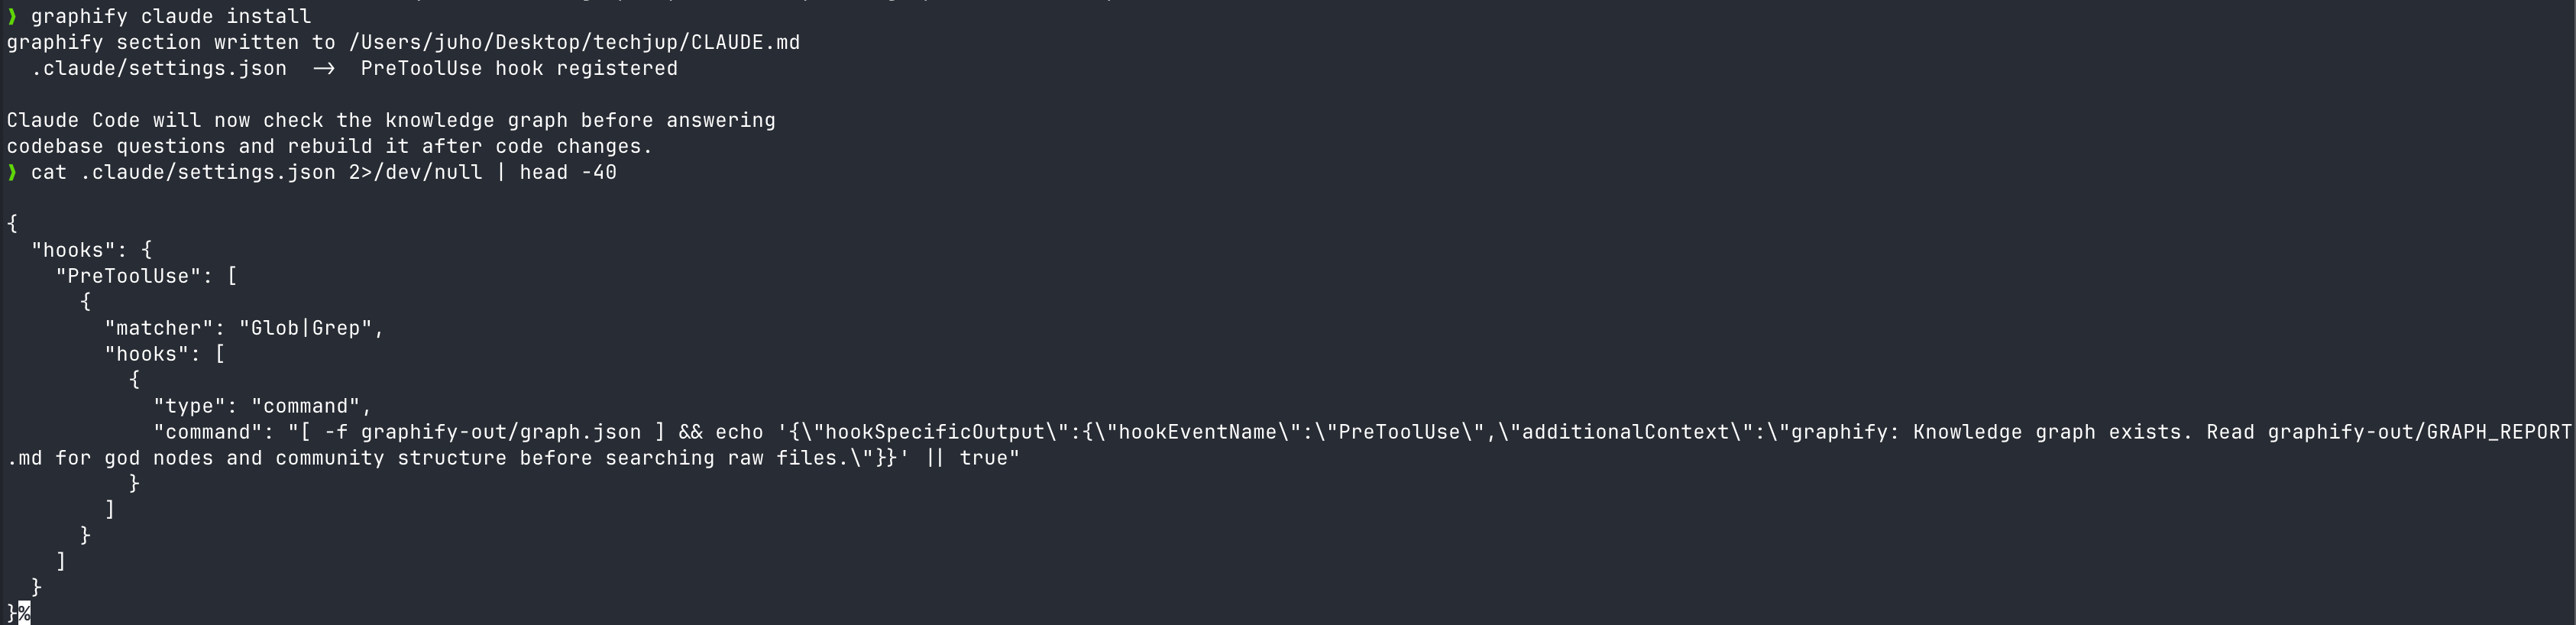
Running graphify claude install registers a hook in .claude/hooks.json like this (source: main.py).
{
  "matcher": "Glob|Grep",
  "hooks": [{
    "type": "command",
    "command": "[ -f graphify-out/graph.json ] && echo '{\"hookSpecificOutput\":{\"hookEventName\":\"PreToolUse\",\"additionalContext\":\"graphify: Knowledge graph exists. Read graphify-out/GRAPH_REPORT.md for god nodes and community structure before searching raw files.\"}}' || true"
  }]
}
That’s all of it. Right before the Glob or Grep tool is called, a single sentence is slipped in via the additionalContext field within the 10,000-character cap (source: Claude Code hooks docs). additionalContext is supported on Claude Code v2.1.9+.
A nudge: “don’t grep — look at the graph first”
The message body reads as a suggestion, not a command. “Knowledge graph exists. Read … before searching raw files.” Claude reads this hint and starts by calling Read graphify-out/GRAPH_REPORT.md. If the answer is in the graph, it skips the original grep; if not, it falls back to the source — a two-stage structure.
Combined with Claude Code’s CLAUDE.md system, it gets stronger. Pinning “look at GRAPH_REPORT first” at the top of CLAUDE.md gives you double defense alongside the hook.
# Add to the top of CLAUDE.md
## Search Priority
1. graphify-out/GRAPH_REPORT.md — architecture overview and god nodes
2. graphify-out/graph.json — neighbor relations of specific nodes
3. Grep / Glob — only when the above don't find it
Per-platform hook equivalents
The same logic is ported to agents beyond Claude.
| Platform | Hook file | matcher | Mechanism |
|---|---|---|---|
| Claude Code | .claude/hooks.json | Glob|Grep | PreToolUse + additionalContext |
| Codex | .codex/hooks.json | tool_use | Bash command (JSON stdout) |
| Gemini CLI | settings.json | read_file|list_directory | BeforeTool hook |
| OpenCode | opencode.config | tool.execute.before | JS plugin |
For internal codebases with sensitive documents, you can consider a local LLM + Graphify hybrid path before injecting the hook by referring to the Gemma 4 local install guide.
How do you ingest Korean HWP, PDF, and news?
English-language guides usually wrap up with a GitHub repo like nanoGPT. Korean environments deal with HWP and PDF much more often, plus crawls from domestic news sites. Here’s the most realistic pipeline.
Graphify can’t read HWP — pre-conversion is required
.hwp and .hwpx are not in Graphify’s DOC_EXTENSIONS list. Even with the office extra installed, that doesn’t change — the targets are pyhwp and python-docx (source: pyproject.toml).
The fix is pre-conversion. Three options compared:
| Tool | Conversion format | Korean quality | Automation |
|---|---|---|---|
| kordoc (chrisryugj/kordoc) | HWP/HWPX → Markdown | Excellent table/TOC preservation | CLI + MCP server |
| pyhwp + olefile | HWP → TXT | Lost formatting, body only | Python script |
| Hangul 2020 COM (Windows only) | HWP → DOCX → Graphify | Full formatting preservation | Requires pywin32 |
| RHWP Chrome extension | HWP web preview | Read-only, no conversion | Manual copy |
For personal-document scale, opening with the RHWP Chrome extension and copying just the essentials into Markdown is the fastest. For batch conversion of dozens of documents, kordoc is safest.
PDFs flow in automatically with the pypdf + html2text combo
Just running pip install "graphifyy[pdf]" brings in pypdf and html2text as dependencies. After that, graphify . auto-recognizes .pdf files, extracts text, and inserts them as semantic nodes. Scanned PDFs (image-based) are ignored since OCR isn’t run.
Korean labels themselves are now safe. Early v0.4.x crashed with UnicodeEncodeError on Windows when node labels contained Korean or emoji, but v0.4.2 forced encoding="utf-8" on all file IO, and v0.4.10 introduced a norm_label field with Unicode NFKD normalization so Korean identifiers and search matching no longer break (source: CHANGELOG v0.4.2/v0.4.10).
When you put papers like FlashAttention or GPT-1 alongside nanoGPT, the CausalSelfAttention in code and the “multi-head attention” section of the paper get bridged by INFERRED edges. In the author’s experiments, this bridge gave the question “where should I apply FlashAttention” a 100.8x token reduction (source: review.md).
News, blogs, YouTube — graphify add <url>
URL-level ingest is supported.
graphify add https://example.com/article
graphify add https://youtube.com/watch?v=xxx  # requires the video extra
YouTube fetches captions/audio via yt-dlp and transcribes with faster-whisper. The default is --whisper-model medium, where Korean CER (character error rate) sits at 11.13% — nearly 3x the English 3.91% (source: Whisper KsponSpeech benchmark comparison).
For Korean conference videos heavy with technical jargon, bump up to --whisper-model large-v3, or run the lighter, lower-CER ENERZAi EZWhisper (13MB) separately to make captions and feed them in via graphify add <txt_path>.
71x token reduction — what will it be on your codebase?
The “71.5x” number grabs attention, but on its own it can’t be reproduced. Measurement conditions and reproduction methods need to be disclosed precisely to be trusted.
Source: worked/karpathy-repos/review.md
The measurements are recorded in worked/karpathy-repos/review.md inside the Graphify repo (source: review.md).
| Metric | Value |
|---|---|
| Corpus | nanoGPT + minGPT + micrograd + 5 PDFs + 4 images = 52 files |
| Total words | ~92,616 words |
| Naive tokens | ~123,488 tokens |
| Graph size | 285 nodes (163 AST + 112 semantic), 340 edges, 53 communities |
| Average subgraph token | 1,726 tokens/query |
| Result | Average 71.5x (123,488 ÷ 1,726) |
Swings from 5.4x to 71.5x depending on corpus size
Run the same measurement on differently sized corpora and 71.5x is close to the ceiling. Two other worked examples the author also published make the difference plain.
| Corpus | File count | Reduction | Reproduction folder |
|---|---|---|---|
| Karpathy 3 repos + 5 papers + 4 images | 52 | 71.5x | worked/karpathy-repos/ |
| Graphify source + Transformer paper | 4 | 5.4x | worked/mixed-corpus/ |
| httpx (synthetic Python lib) | 6 | ~1x | worked/httpx/ |
The author himself notes in the README: “Token reduction scales with corpus size. With 6 files, everything fits in context anyway, so the value of the graph isn’t token compression but structural clarity” (source: README.md). So the first step is to size your own repo and adjust expectations. Below 50 files, Graphify’s value shifts away from “token reduction” toward “structural understanding via god nodes and communities.”
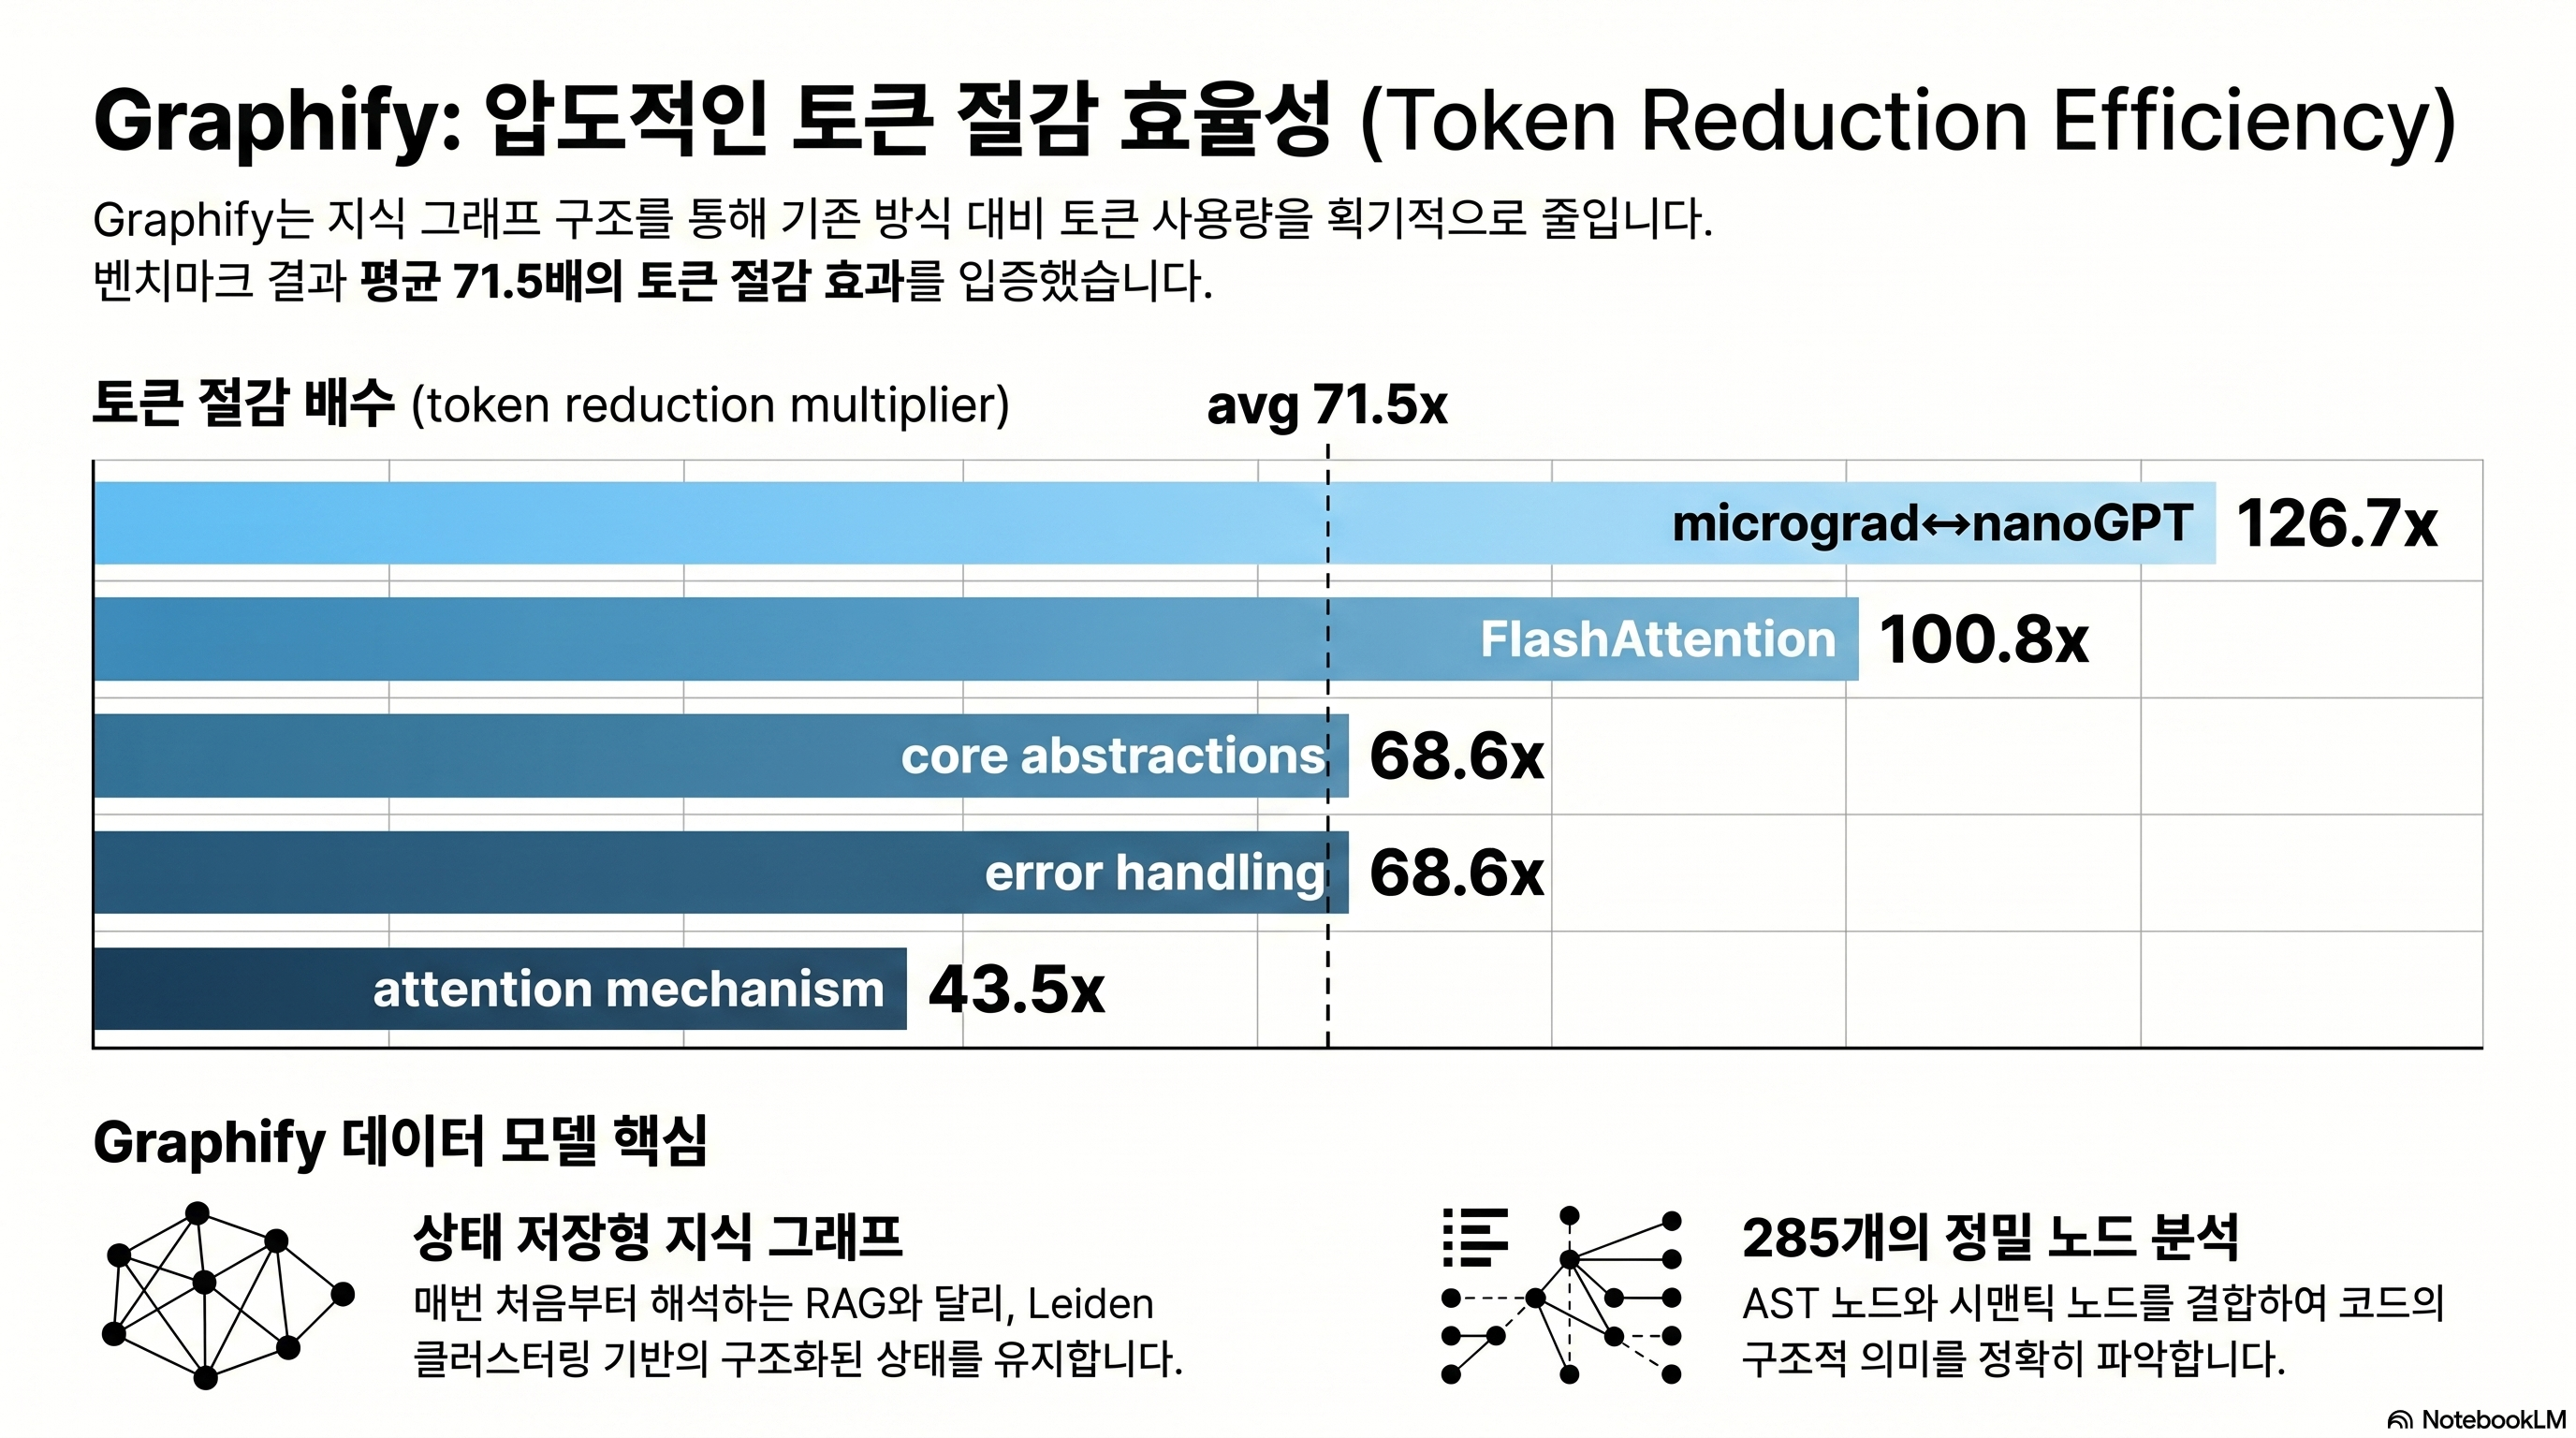
Per-question variance: from 43.5x to 126.7x
Beyond a single average, results across 5 benchmarks vary by question difficulty.
| Question | Token reduction |
|---|---|
| micrograd ↔ nanoGPT comparative explanation | 126.7x |
| FlashAttention application points | 100.8x |
| List core abstractions | 68.6x |
| Error handling flow | 68.6x |
| Attention mechanism overview | 43.5x |
Comparison questions produce the biggest reductions. Why? Comparisons need to scan multiple codebases at once, which is what’s most expensive in the naive approach. Conversely, “attention mechanism overview” has its answer concentrated in one section, so even the naive method spends relatively little.
Reproduction in 3 steps
# 1) Prepare the same corpus as the author
git clone https://github.com/karpathy/nanoGPT
git clone https://github.com/karpathy/minGPT
git clone https://github.com/karpathy/micrograd

# 2) Build the graph
graphify . --pdf

# 3) Measure with benchmark.py
python -m graphify.benchmark --queries queries.json --depth 3
Reproducibility assessment: 3 caveats
Pros
- + Measurement code is in the repo so the same corpus reproduces directly
- + Per-question variance is reported in detail so you can read the average's context
- + The 8.8x lower bound for code-only (29 files) is also published
Cons
- − Token estimation uses simple len(text)//4 — re-measuring with tiktoken/Anthropic tokenizer can shift the numbers
- − Naive baseline is a formulaic word_count*100//75 estimate — error vs actual Claude prompt tokens
- − BFS depth=3 is fixed — results swing greatly with depth and query variety
Real cost drops further with Sonnet/Opus task split
To convert 71x reduction directly into dollars, you also need to look at Claude Opus 4.7’s 1.35x token issue. Opus 4.7 spends an average 1.35x more tokens than Sonnet 4.5 for the same question, and if Graphify pre-narrows context, that multiplier comes back as direct cost difference.
In practice, a 2-stage pipeline — Sonnet first summarizes GRAPH_REPORT, then Opus only gets the necessary subgraph — sits closest to the cost-quality optimum.
Graphify vs code-review-graph vs graphiti — which one now?
Graphify isn’t the only one. As of 2026, at least 4 tools compete on “turn the codebase into an LLM-ready graph.” The selection criteria depend on your information design goal.
Positioning of 4 tools
| Tool | Main target | Clustering | LLM calls (ingest) | Notes |
|---|---|---|---|---|
| Graphify v0.4.23 | Code + doc mix | Leiden (Louvain fallback from 3.13) | 0 | One-stop Claude Code hook, supports 14 agents |
| Microsoft GraphRAG | Long docs / RAG-only | Leiden + hierarchical summary | Tens to hundreds | Pre-stored hierarchical LLM summaries, expensive indexing |
| LightRAG | General-purpose RAG alternative | None (flat graph) | For entity extraction | Vector + graph dual retrieval, low cost |
| nano-graphrag | Learning / experimentation | Yes | Top-k communities only | 1,100 LoC lightweight, Faiss/Neo4j/Ollama assembly |
Microsoft GraphRAG fits teams whose main job is summarizing and searching long documents. Graphify specializes in “make Claude understand my codebase fast.” The two have different goals (source: Microsoft GraphRAG).
llm-wiki-mcp — a markdown wiki alternative, not a graph
Lucas Astorian’s lucasastorian/llmwiki goes a different direction. Postgres + Supabase + S3 + embeddings + keyword hybrid, with guide/search/read/write/delete exposed via MCP tools. Claude edits the wiki directly and accumulates its own memory (source: llmwiki).
If you need the graph-less “agent grows by writing notes” approach, llm-wiki-mcp. If “understand existing code fast” is the goal, Graphify.
Decision flowchart
- “Make Claude Code read our repo fast” → Graphify
- “Q&A over hundreds of pages of research docs” → Microsoft GraphRAG
- “Open source, minimal cost, 70% quality is fine” → LightRAG
- “Agent learns by writing its own wiki” → llm-wiki-mcp
- “Tear apart 1,100 lines yourself to learn” → nano-graphrag
What are the 3 traps that bite hardest in practice?
Beyond the bugs caught across v0.4.16 to v0.4.23 over two weeks, three traps recur in the GitHub issue tracker and community reviews.
Trap 1. AST and semantic layers don’t meet (Issue #198)
The sharpest academic critique. AST nodes are made as SentenceTransformer (the code identifier), and if a semantic node gets extracted from a document as “sentence transformer” (with a space), the IDs differ and exact match fails. The result: bridges between code and documents don’t form as much as you’d expect (source: Issue #198).
In the v5 design doc (committed 2026-04-16), the author writes that canonical labels, post-merge entity resolution, and explicit code-to-concept linking will address this. Using v0.4.23 today, it’s safer to factor in this gap and visually scan GRAPH_REPORT.md once to manually shore up missed connections in CLAUDE.md.
Trap 2. Python 3.13 + Leiden expectation = Louvain reality
The graspologic dependency issue mentioned earlier is the most frequently reported. Set up freshly with Python 3.13 and even installing graphifyy[leiden] silently fails, falling back to Louvain. It runs without an error message, causing confusion like “why are my communities different from the author’s review?”
# If you want Leiden while using 3.13, recommend a separate 3.12 venv
pyenv install 3.12.7
pyenv virtualenv 3.12.7 graphify-312
pyenv activate graphify-312
pip install "graphifyy[leiden]"
Trap 3. Windows PowerShell 5.1 buffer corruption
A long-standing bug logged in Issue #19. PowerShell 5.1 can’t parse ANSI escape codes, so graphify progress logs corrupt the terminal buffer. Graphify ships internal _suppress_output workaround code that mitigates this in recent versions, but upgrading to PowerShell 7+ is the root fix (source: cluster.py).
Running it on WSL2 Ubuntu is the safest. macOS/Linux users won’t run into this.
- "The number of times Claude Code gets lost during exploration cut roughly in half by feel. Especially clear on comparison tasks across multiple repos." — Kevin Kinnett review
- "/compact eating tokens every time was annoying, so I built a local compression daemon with Ollama and feed Graphify data for $0 — now token costs are basically nothing." — r/ClaudeAI · Agreeable_Ad_1731
- "For full-stack multimodal projects (React + PDF + images), Graphify is overwhelming. But for blast-radius tracking on pure Python/ML backends, code-review-graph is better — splitting the two is the right answer." — r/ClaudeAI · ganesh_agrahari
- "Fed in 1.52M words of Korean technical docs, and just looking at the god node concept list is enough to organize things." — Gpters community feedback
- "Building the graph is fine. The problem is 'knowledge drift' — duplicate nodes, broken relations, and stale assumptions accumulate over time. Without auto-lint and periodic health checks, it eventually collapses." — r/ClaudeAI · FragmentsKeeper
- "AST nodes and semantic nodes only connect when their IDs match exactly, so `SentenceTransformer` (code) and `sentence transformer` (doc) don't match — code-to-doc bridges don't form as expected." — GitHub Issue #198
- "Token reduction is barely felt with under 50 mixed files. Mid-to-small codebases give the impression Claude's default grep is enough." — Kevin Kinnett review + r/ClaudeAI ganesh_agrahari
After reading this, where should you start?
Key takeaways
Graphify is a tool that slips a “compiled code map” in front of Claude Code. Installation is one line — pip install graphifyy — but real value lands the moment graphify install --platform claude wires in the PreToolUse hook. The 71.5x token reduction is an average for a specific corpus (Karpathy 52 files); the lower bound of 8.8x on smaller repos has to be remembered too. The single core action is “measure it on your own repo.”
- Teams with large monorepos: 50+ files, doc-code mix. Maximum return when grep-based exploration has hit its limit.
- Individuals experimenting with Karpathy-style LLM wikis: readers who finished Part 1 — Concept Guide and got stuck on “but how.”
- Engineers optimizing cost via Sonnet + Opus task split: using Opus on the subgraph Graphify narrowed offsets the 1.35x penalty.
- Developers building AI on Korean HWP/PDF-based internal docs: scenarios where you build a preprocessing pipeline first with kordoc or the RHWP Chrome extension.
Prepare a Python 3.12 virtual environment
3.13 has the Leiden fallback issue, so use pyenv to install 3.12.7 in a separate venv.
Run pip install graphifyy
Mind the typo. Two y's. If you'll be handling PDFs/videos, include the extras.
First graphify . on a small repo
Start with a sandbox repo, not your main code. Get familiar with the graphify-out artifact structure.
Wire the hook with graphify install --platform claude
Confirm that additionalContext actually gets injected right before Glob/Grep in real Claude Code.
Measure your repo's token reduction directly with benchmark.py
Pull your codebase's actual multiplier as a number — not the author's 71.5x.
Add search priority to CLAUDE.md
Double defense with the hook. 1st GRAPH_REPORT, 2nd graph.json, 3rd Grep.
- Graphify v4 official README
- ARCHITECTURE.md — design background and 3-tier compilation
- worked/karpathy-repos/review.md — original 71.5x measurement
- Issue #198 — AST-semantic separation critique
- Claude Code hooks official docs
- Traag et al. 2019 — From Louvain to Leiden
- Microsoft GraphRAG
- llm-wiki-mcp (lucasastorian/llmwiki)
- kordoc — HWP/HWPX Markdown converter
- Kevin Kinnett Graphify review
- PyTorch Korea Graphify discussion
Next post preview — 6-month operations guide
This post stops at install and first build. Run it for 6 months in real life and new problems emerge: the 400K-word threshold, hallucination contamination, lint omissions, monorepo partial rebuild. Part 3 will cover wiring Graphify into CI, building a weekly rebuild pipeline, and strategies to prevent GRAPH_REPORT drift. Read this post bundled with Part 1 — Concept Guide for the foundation needed to actually implement Karpathy LLM Wiki in code.
Frequently asked questions
Should I install graphify or graphifyy?
I'm on Python 3.13 and Leiden clustering doesn't seem to work.
Will I get the same 71.5x token reduction on my repo?
How do I get Korean HWP documents into the graph?
Can the PreToolUse hook actually block Claude's tool calls?
Microsoft GraphRAG or Graphify — which should I use?
Is it OK to process internal sensitive code with Graphify?
It claims 25 languages — how many is it really?
Was this helpful?
One tap shapes what gets written next.
Topic tags

Andrej Karpathy's 4 AI Coding Warnings and the 100K-Star CLAUDE.md Repo
A deep dive into the four bad AI coding habits Karpathy warned about, the CLAUDE.md repo's four operating principles, what evidence supports them, and where the limits still are.
Read
GLM 5.1 Review: Run Claude Code at 1/5 the Price with Open-Weight SOTA
How to run GLM 5.1 in Claude Code at one-fifth the cost, plus what Z.AI's official docs reveal about subscription-backed API access, Vision MCP, and GLM-Image.
Read
Claude Code Review: Complete Guide (2026)
Honest Claude Code review covering installation, pricing, vs Cursor, pros and cons — everything in one post.
Read